
Seeing the Invisible: Why Energy Inspection Needs a New Lens
When I first walked into a century‑old farmhouse with a drafty attic, the thermostat read a steady 70 °F, yet the homeowner swore the heating bill was spiraling. That paradox is the hallmark of hidden energy loss, where walls, roofs, and even floor joists whisper secrets that a traditional visual walk‑through simply can’t catch. Thermal imaging turns those whispers into vivid heat maps, giving us a forensic view of where your home is leaking comfort and cash.
Thermal Imaging 101: From Gadget to Game‑Changer
The modern infrared camera is compact enough to fit in a toolbox, yet powerful enough to detect temperature differences as slight as 0.1 °C, revealing gaps behind insulation, faulty ductwork, and sun‑warmed exterior walls. I remember the first time I lifted the camera to a sun‑baked siding and saw a bright orange halo where a single missing shingle let heat escape like a faucet left running. By translating those colors into actionable data, we move from guesswork to precision repairs.
Reading the Heat Map: Turning Colors into Action
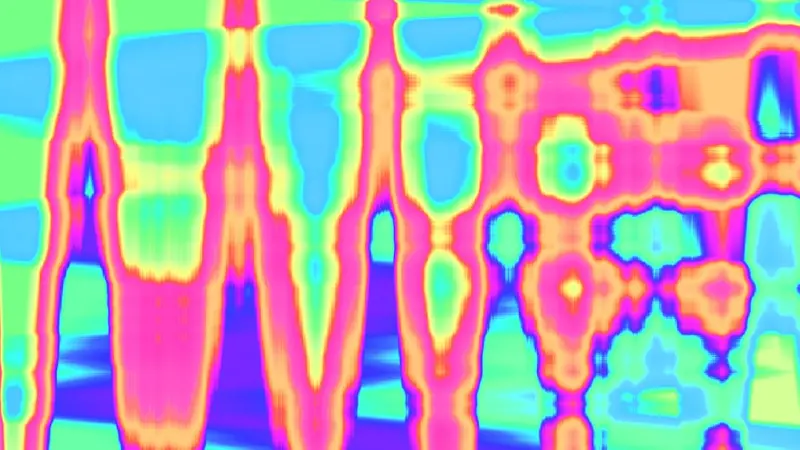
A thermal image isn’t just a pretty picture; it’s a diagnostic report written in gradients of red, yellow, and blue. Warm spots (reds) often signal air infiltration or inadequate insulation, while cool patches (blues) may reveal moisture accumulation that can later become mold. I coach homeowners to focus on the “thermal hotspots” that align with high‑energy‑use rooms, because fixing those first yields the biggest savings on the next utility bill.
Beyond the Camera: Merging Smart Meter Data with Infrared Insight
Smart meters record kilowatt‑hour spikes down to the minute, but without context they’re just numbers. By overlaying meter data with thermal snapshots, we can pinpoint exactly which wall or window is responsible for a sudden surge during the night. In a recent audit, a seemingly innocuous bedroom window that showed a subtle blue‑green fringe was the culprit behind a 15 % increase in nighttime heating load—once sealed, the home’s energy profile flattened dramatically.
Human Behavior Meets Technology: The Occupant‑Centered Audit
Even the most airtight envelope can be undercut by habits like propping doors open or using space heaters indiscriminately. I ask occupants to keep a simple log of window positions and supplemental heating use, then cross‑reference those entries with thermal data to identify patterns. When a family realized that leaving a single kitchen door ajar during cooking added a hidden heat loss equivalent to a cracked wall, they adjusted their routine and instantly felt the difference.
Cost‑Benefit Calculus: When to Invest in Deep‑Dive Inspections
Thermal imaging equipment ranges from entry‑level models at a few hundred dollars to professional‑grade rigs costing several thousand. For most homeowners, the sweet spot is a targeted inspection focused on high‑impact areas—attics, basements, and sun‑exposed facades—paired with a quick data‑review session that translates findings into a clear ROI estimate. In my experience, a $500 thermal scan followed by modest sealing work typically pays for itself within one to two heating seasons.
Common Pitfalls and How to Avoid Them
One mistake I see repeatedly is conducting thermal scans in direct sunlight, which can mask real heat loss behind a “false warm” reading. Another is relying solely on infrared images without a physical follow‑up; a hotspot might be a harmless solar gain rather than a defect. To stay on the right track, schedule inspections on overcast days or in the early morning, and always combine visual verification with the thermal data.
Actionable Checklist: Your DIY Energy‑Inspection Primer
- Schedule a cloudy‑day scan of attic, basement, and exterior walls.
- Mark red‑hotspots and note any corresponding drafts or moisture.
- Cross‑check hotspots with smart‑meter usage spikes.
- Log occupant habits that could influence thermal readings.
- Seal gaps, add insulation, or replace faulty windows as indicated.
- Re‑scan to confirm temperature normalization.
Following this routine empowers you to catch leaks before they snowball into costly repairs, and it turns a once‑intimidating audit into a repeatable habit.
Future‑Ready Homes: Integrating Drones and Data for Next‑Level Audits
While infrared cameras give us a close‑up view, drones can lift the perspective to the roof, chimney, and high‑elevation walls, capturing heat signatures that are impossible to reach from the ground. Pairing drone‑assisted inspections with the drone‑assisted inspections methodology expands our coverage, especially for multi‑story homes where ladder work is risky. Coupled with the insights from energy inspection best practices, you’ll have a comprehensive, data‑driven roadmap that future‑proofs your home against rising energy costs.

When it comes to the world of blogging and writing, Rose DesRochers is a name that stands out. Her passion for creating quality content and connecting with her audience has made her a trusted voice in the industry. Aside from her skills as a writer and blogger, Rose is also known for her compassionate nature.
Related Posts

Unlocking the True Value of Energy Inspections
A deep dive into why energy inspections matter, the tech tools used, and real‑world fixes that tur... Read More

From Spot Checks to Smart Scans: How AI and Drones Are Redefining Energy Inspection
A deep dive into the next generation of energy inspection, exploring AI-driven analytics, drone ther... Read More

Why Energy Inspections Are Crucial For A Sustainable Future
Energy inspections play a vital role in reducing our carbon footprint and promoting sustainability. ... Read More
Top Posts

The Secret Language of Paint: How Color, Finish, and Prep Transform Your Home
Explore the hidden power of paint—learn to choose colors, finishes, and prep methods that instantly elevate your home’s style and comfort....Read More
Elevating Window Treatments: Smart, Sustainable, and Sensory Solutions for Modern Homes
Explore cutting‑edge window dressing strategies that blend technology, sustainability, and design, turning ordinary windows into health‑boosting, energy‑s...Read More
Creating a Wellness‑Focused Kitchen: Health‑Centric Renovation Ideas
Discover how to redesign your kitchen for better air quality, calming light, natural materials, and smart storage, turning the heart of your home into a wellnes...Read More
Mastering Home Weather Proofing: A Sustainable, Smart Approach
A practical guide to weather proofing your home, blending smart tech, sustainable materials, and easy maintenance for lasting comfort and energy savings....Read More
0 Comments
Post Comment
You will need to Login or Register to comment on this post!