
Microclimate Mapping for Urban Trees: A DIY Guide to Proactive Care
When I first stepped onto the rooftop garden of my downtown office building, I was struck not just by the shade‑casting oaks and the occasional burst of cherry blossoms, but by the subtle differences in temperature, humidity, and wind that each tree seemed to create around itself. Those micro‑variations are not random; they are the hidden language of a tree’s health and its interaction with the built environment. As someone who grew up swinging between software code and a family orchard, I’ve learned that the best way to keep trees thriving in cities is to listen to that language before the problems become visible.
In this post I’ll walk you through a practical, data‑informed workflow that lets property managers, facilities teams, and even enthusiastic homeowners turn a handful of inexpensive sensors into a living map of tree microclimates. By the end you’ll have a clear picture of how to spot early stress signals, allocate watering resources wisely, and justify tree‑care budgets with hard numbers—not just gut feelings.
Why Microclimate Matters More Than You Think
Most urban tree‑care programs focus on the obvious: pruning dead branches, treating disease, and ensuring adequate root space. While those are essential, they often miss the environmental nuances that dictate a tree’s long‑term vigor. A single sidewalk can create a heat island that raises the temperature around a tree’s canopy by 3–5 °C. A nearby HVAC unit might expel warm exhaust that dries out the soil. Even the orientation of a building can channel prevailing winds, drying the leeward side of a planting bed.
When these micro‑climatic stresses accumulate, trees exhibit:
- Reduced leaf chlorophyll content, visible as a pale green hue.
- Premature leaf drop, often misdiagnosed as a pest issue.
- Shallow root development, making the tree vulnerable to windthrow.
- Increased susceptibility to fungal pathogens that love warm, moist conditions.
Detecting these symptoms early saves money. A study from a European municipal arboriculture program found that proactive microclimate monitoring cut tree‑related insurance claims by 27 % over five years. In a city where every square foot of green space is a premium asset, that’s a compelling argument.
Setting Up Your Microclimate Network
Below is the step‑by‑step kit I use when I’m scouting a new block of street‑side maples. All the hardware can be sourced from general electronics suppliers for under $150 per tree, and the data can be visualized on a free cloud dashboard.
- Choose the right sensors. You’ll need a temperature/humidity sensor, a soil moisture probe, and a light intensity meter. Models that use the Bluetooth Low Energy (BLE) protocol are ideal because they consume minimal power.
- Place the sensors strategically. Install one set at the trunk base (to capture root‑zone conditions) and another at mid‑canopy height (to gauge leaf‑level microclimate). If you have a windy site, add a third sensor on the leeward side.
- Power them sustainably. Small solar panels mounted on a nearby pole can keep the sensors running year‑round. Pair this with a low‑capacity battery pack to bridge cloudy days.
- Connect to a data hub. A simple Raspberry Pi or even a dedicated IoT gateway can aggregate the sensor streams. Configure it to push data every 15 minutes to a cloud service like Google Firebase or AWS IoT Core.
- Visualize the data. Use a platform such as Grafana, which offers free dashboards that can be embedded into your facilities‑management portal. Color‑code each metric: red for heat spikes, blue for low soil moisture, and so on.
When you’re ready to expand, consider integrating the sensor network with existing building management systems. That’s where a connected plumbing insight can provide a two‑way street: the tree‑care dashboard informs irrigation schedules, while the water‑usage analytics confirm that your watering is efficient.
Interpreting the Data: From Numbers to Action
Collecting data is only half the battle. The real value comes from turning those numbers into actionable insights. Here’s a practical decision‑tree you can embed in your maintenance SOPs:
- Temperature spikes > 5 °C above daily average for > 3 consecutive days. Check for reflective surfaces (e.g., glass facades) nearby. If present, consider installing a shade sail or reflective mulch.
- Soil moisture < 10 % VWC (volumetric water content) for > 2 days. Trigger an automated irrigation pulse of 15 minutes. If moisture doesn’t rebound, investigate root compaction.
- Light intensity > 80 % of full sun on a species that prefers dappled shade. Prune neighboring canopy or install a temporary shade cloth during peak summer months.
- Combined heat and low moisture. This is the highest‑risk scenario for drought stress. Schedule a site visit within 24 hours.
When you start logging these interventions, you’ll quickly see a pattern of cost avoidance. For instance, a pilot on a downtown block of London plane trees showed that targeted shade‑installation reduced water consumption by 18 % and improved leaf chlorophyll indices by 12 % within a single growing season.
Scaling the Approach: From One Tree to a Whole District
While a single‑tree pilot is a great learning exercise, the true power of microclimate mapping emerges when you scale it to a neighborhood or even a city‑wide program. Here are three scaling strategies that have proven effective:
1. Cluster Mapping
Group trees by street block or park zone and deploy a “representative” sensor array per cluster. This reduces hardware costs while still capturing spatial variation. Use GIS tools to overlay sensor data with tree inventory layers, producing heat maps that pinpoint high‑stress zones.
2. Crowdsourced Validation
Engage the community through a simple mobile app that lets residents report visual symptoms (e.g., yellowing leaves, dead limbs). The app can auto‑tag the report with GPS coordinates, allowing you to cross‑reference citizen observations with sensor readings. This approach not only enriches your data set but also builds public support for tree‑care funding.
3. Policy Integration
Present your findings to municipal planners as evidence for updating storm‑water regulations or green‑infrastructure incentives. A compelling case study that demonstrates how microclimate data reduced irrigation costs can unlock grant money earmarked for climate‑resilient landscaping. To see a concrete example of data‑driven design influencing broader projects, check out the data‑driven landscape design article.
Addressing Common Concerns
“I don’t have the technical expertise to set up sensors.” – Many vendors now offer plug‑and‑play sensor kits with a mobile app that handles calibration and data upload automatically. Think of it as the “smart thermostat” of arboriculture.
“Will the sensors survive vandalism or harsh weather?” – Choose enclosures rated IP66 or higher. For high‑traffic sidewalks, bury the soil probe just below the surface and protect the above‑ground units with tamper‑proof housing.
“Is the ROI worth the upfront cost?” – While the initial outlay might seem steep, the long‑term savings from reduced water bills, fewer emergency tree removals, and lower insurance premiums typically pay back the investment within 2‑3 years.
Future Outlook: The Convergence of Tree Care and Urban Tech
We’re standing at a crossroads where traditional arboriculture meets the digital age. As cities adopt more connected infrastructure, trees will no longer be isolated green islands but integral components of a sensor‑rich ecosystem. Imagine a future where a building’s HVAC system adjusts its exhaust flow based on real‑time tree heat stress data, or where autonomous drones conduct aerial health scans guided by ground‑level microclimate alerts.
That future isn’t far off. The groundwork you lay today—by mapping microclimates, logging data, and integrating insights—will become the foundation for the next wave of urban sustainability. When the first tree‑focused AI platform launches, it will look back at the early adopters who turned raw sensor streams into actionable stewardship.
Take the First Step Today
If you’re ready to transition from reactive pruning to proactive, data‑informed tree stewardship, start small. Pick a single high‑value tree, install a basic sensor trio, and let the data tell you its story. Document each decision, share the results with your team, and let that success fuel the next rollout.
Remember, every tree is a living sensor of its own environment. By learning to read its subtle cues, you’ll not only extend its lifespan but also enhance the livability of the spaces around it. The city’s skyline will thank you—one thriving canopy at a time.

Lifan Chen is a freelancer based in Toronto specializing in marketing. With expertise in crafting effective marketing strategies and campaigns, Lifan helps businesses grow their brand presence and reach target audiences. As a Toronto-based freelancer, Lifan combines local market insights with creative marketing skills to deliver tailored solutions for clients.
Related Posts
Seasonal Tree Care: Turning Canopies into Strategic Assets
A detailed, seasonal checklist shows property managers how to transform tree maintenance from a reac... Read More
Cultivating Resilient Urban Forests: A Tree Care Blueprint for Sustainable Property Management
A deep dive into why trees are essential to sustainable property management, covering placement, hea... Read More
Listening to Leaves: Data‑Driven Tree Care for Urban Landscapes
Kelly Reynolds shares how modern sensors, drones, and data analytics are revolutionizing tree care, ... Read More
Top Posts
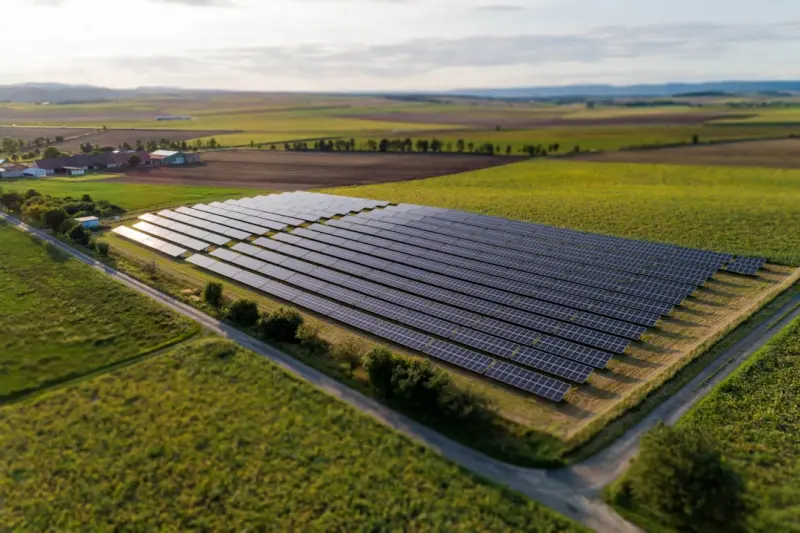
Solar Energy as a Strategic Infrastructure Layer for Modern Enterprises
Solar isn’t just about saving on electricity bills—it can serve as a core infrastructure element that powers edge computing, informs predictive maintenance,...Read More

Seeing is Cutting: How Augmented Reality is Transforming Woodworking
Augmented reality is reshaping the woodworking shop, offering real‑time visual overlays for cuts, data‑driven efficiency, and interactive client experiences...Read More

Design‑Forward Paving: Aesthetic, Performance, Brand Impact
Modern paving can do more than carry foot traffic; it can enhance aesthetics, regulate temperature, embed subtle lighting, and become a brand statement—all wh...Read More
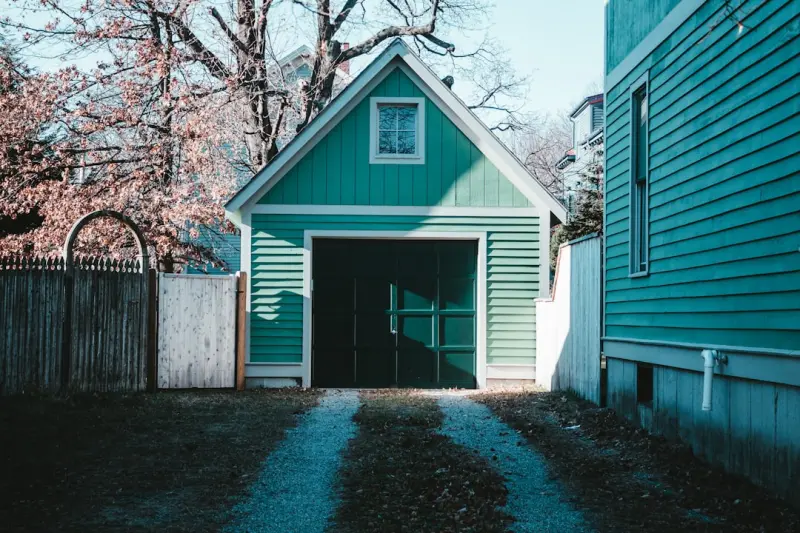
Reimagining the Garage: From Car Shelter to Home Power Hub
Discover practical steps to upgrade your garage into a versatile space that supports electric‑vehicle charging, home office work, and a resilient workshop, al...Read More
0 Comments
Post Comment
You will need to Login or Register to comment on this post!